Wind
Current measured values ( 0:00 o'clock)
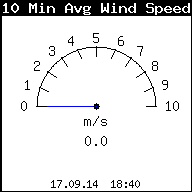
Because the wind speed is a varying strongly measured value, an averaging is good in the 10-minute-interval. This value is more significant than the pure current measured value is.
During the conversion of the wind direction into degree units following conversion is valid:
- North (N) – corresponds to 0° and/or 360°
- East (E) – corresponds to 90°
- South (S) – corresponds to 180°
- West (W) – corresponds to 270°
| Wind speed | Wind direction | ||
|---|---|---|---|
| Current value | 10 min average value | ||
| Graph | 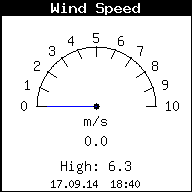 |
 |
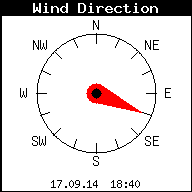 |
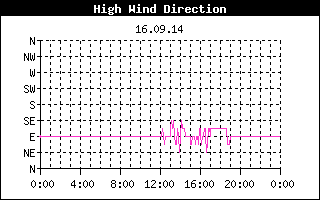
| Value | 0.4 m/s | 0.4 m/s | E (85°) |
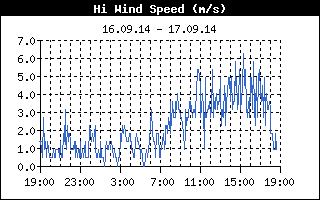
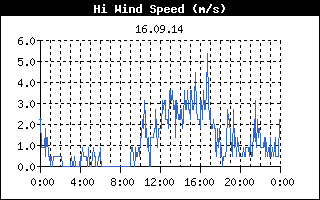
| Maximum | 5.4 m/s at 16:44 o'clock |
||

History
Course of the day
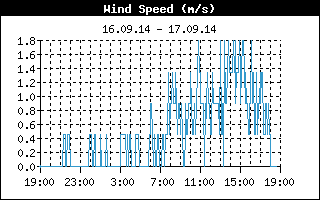
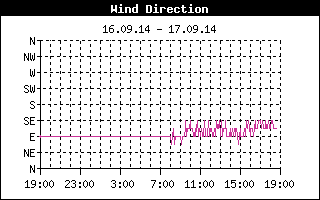
The wind speed and the gusts are represented. Often the wind weakest at night off. In the diagram of the wind direction calm points out through horizontal lines. The horizontal lines arise through the change of the wind direction of for example north-west to northeast.
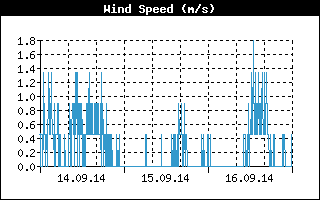
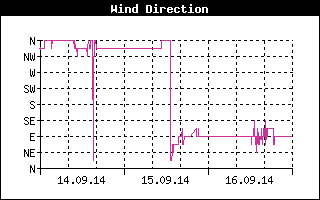
Last days and last month
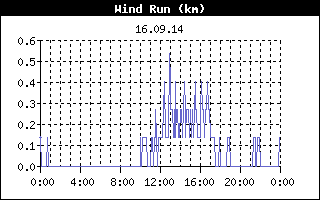
Besides the representation of the three day long wind speed and wind direction history the monthly figures show an average value from the normally very much variable speeds and directions. The gusts are used in this case. In addition "Wind run" indicates, "how much" wind in the period (here a day) is blown at the station. The specification occurs in km.
More measured values
Beside to values above other measurement variables are available:
- Overview with the most important measured values
- Temperature values
- Precipitation and evaporation
- Wetness measures
- Barometer
- Wind
- Radiation and UV
- Soil properties